WebPro Education

Tech tips everyday
Menu
  • REVIEWS
  • HOW TO
  • TECH NEWS
  • About Us
Home
how to
How To Easily Add Error Bars In Excel
how to

How To Easily Add Error Bars In Excel

Catherine Kabaki September 4, 2020

The main purpose of error bars in a chart is to help you see margins of error and standard deviation at a glance.

They can be shown as a standard error amount, a percentage or a standard deviation.

How To Add Error Bars In Excel

Click on any part of the chart and then click on Chart Elements indicated by the + (plus) icon.

Check the Error Bars box and pick your pre-defined error bar option like Standard Deviation, Percentage or Standard Deviation.

how to add error bars in excel

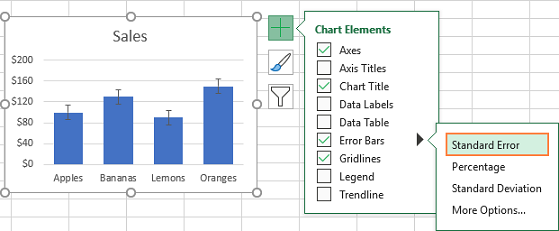
It is as simple as that.

Share
Tweet
Linkedin
Reddit
Tumblr
Stumble
Whatsapp
Telegram
Email
Prev Article
Next Article

Related Articles

How To Mute Sound On Your Instagram Story

How To Mute Sound On Your Instagram Story

How To Connect External Hard Drive To iPad

How To Connect External Hard Drive To iPad

  • How To Share Reels To Instagram Story
  • How To See ALL Follow Requests On Instagram
  • How To Tag (Mention) Someone In Instagram Story After Posting
  • How To Delete CapCut Project
  • How To Change Roaming Clock Region & Time Zone On Samsung Galaxy A36/A26/A56
DMCA.com Protection Status

Associates Disclosure

WebPro Education is a participant in the Amazon Services LLC Associates Program, an affiliate advertising program designed to provide a means for sites to earn advertising fees by advertising and linking to amazon.com.

WebPro Education

Tech tips everyday
Copyright © 2025 WebPro Education

Ad Blocker Detected

Our website is made possible by displaying online advertisements to our visitors. Please consider supporting us by disabling your ad blocker.

Refresh